Typhoon In-Fa Turns Red to Blue
With the inaugural surfing event run and won at the Tokyo Olympics (congrats Italo and Carissa), it's worth looking at some interesting oceanographic interactions that happened in the lead up and during the event.
While Typhoon/Tropical Storm Nepartak was responsible for the low quality, windy swell seen during the event window, immediately before this, Typhoon In-Fa generated large, stormy surf across the southern extent of the country, before passing across the Okinawa Prefecture last weekend.
In-FA developed east of the Phillipines, tracking north-northwest while strengthening, reaching category two with sustained wind speeds of 170km/h (95 kts), immediately south of Okinawa.
From here it stalled and what we can see in the sea surface temperature impression following In-Fa is all the energy used to sustain its intensity and slow movement.

Typhoon In-Fa's track. Source: Zoom.Earth
Tropical storms, be it cyclones, hurricanes, typhoons (all the same but named differently depending on region) need two ingredients to maintain their strength and integrity. The first is water temperatures over 26.5° Celsius, as this provides the energy for the storm to feed off. The warm water warms the atmosphere, which then rises inside the cyclone, cooling and condensing, releasing latent heat which feeds the cyclone further.
Once the water temperature drops below 26.5 there's not enough energy to keep the cyclone going and it will slowly weaken and break down.
The second factor is the upper atmospheric winds, namely wind shear. Cyclones require weak upper atmospheric winds to maintain their structure, and are ripped to pieces with strong wind shear is present.
Knowing that these storms absorb energy from the sea surface, what can easily be seen in the wake of the more significant storms is a cool water impression, visible by satellites in space.
Severe Tropical Yasi which impacted northern Queensland back in 2011 left an incredible sea surface temperature impression, as did Tropical Cyclone Pam in 2015. Also the cyclone activity south of the Fiji region this summer also left a noticeable impression.
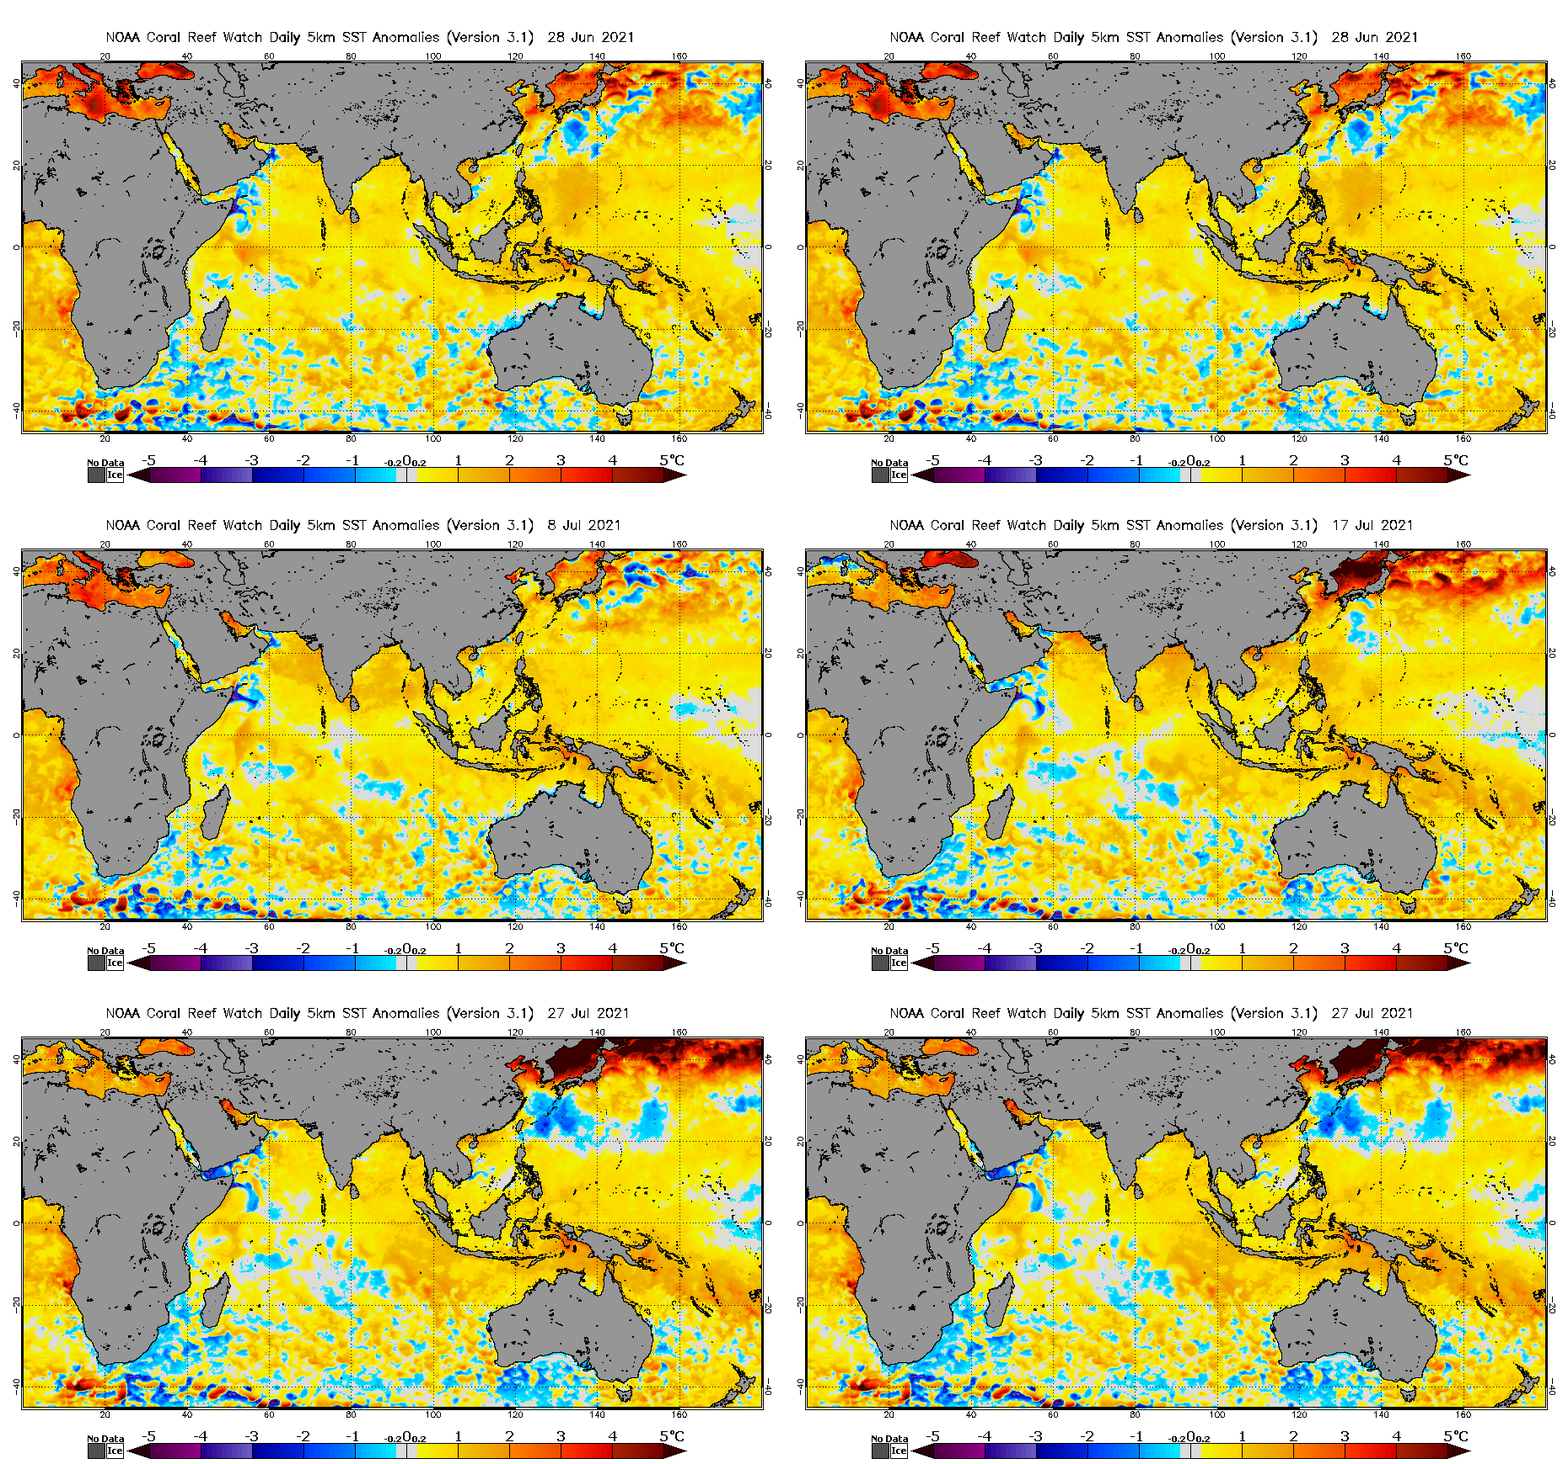
If we look at the sea surface temperature anomaly (difference in temperature from the long-term, climate average) charts below, from before and after the passing of Typhoon In-Fa we can see that temperature's were 1-2° above normal before In-Fa moved through (mid-July), then dropping to around 2° below average after.

Evolution of sea surface temperature anomalies 28th June - 28th July. Note the warming mid-July, south of Japan ahead of the cooling. Source: NOAA
This is a drop of 3-4°, with the impression following the track of In-Fa, to the west and then north across the Okinawa Prefecture, further towards China, into the Yellow Sea.
What also can be seen is the impression from Typhoon Nepartak, north-east of the northern Mariana Islands.
This is a great visual example of the flow of energy from ocean to atmosphere, as the planet constantly searches for equilibrium which will never be met.

Sea surface temperature anomaly charts for July 28th, showing Typhoon In-Fa and Nepartak's temperature impressions. Source: NOAA


Comments
Really enjoy these informative articles.
yeah agree, good work craig
Excellent stuff, Craig.
Cheers.
I don’t understand haha. My brain can’t make sense of that animated image. Shouldn’t it be the other way around. The cold water in the wake of the Typhoon? It feeds from warm and leaves cold?
Im sure there is something plain as day I’m missing confusing me.
Yep, that GIF starts at the 28th of Jun, a bit cooler than normal but the water warmed up into the middle of July before the Typhoons moved through, leaving the cold impression.
So will any of the anthropogenic warming of the oceans be offset by the predicted increase in storm activity? As in, will some of the heat energy be converted to kinetic energy and not simply transferred from the ocean to the atmosphere? I am no physicist, BTW, so this may be a really stupid question. And I'm happy with a "nah, that's a stupid question" in response
Great question and the answer is no, it will just lead to more intense, volatile storms as the ocean and atmosphere continue to warm. These local scale cooling events are relatively quickly mixed back to normal.
Ta Craig
Great explanation how the planet tries to create equilibrium between different areas of the planet.
Thanks guys, really interesting stuff eh.
cracking explanation! Thanks